
A mood tracker that makes feelings visible
CorPerformance's science-backed wellbeing programme, rebuilt as an install-free PWA that turns emotions into a benchmark anyone can read.
- Partner Project
- Install-free PWA
- Employee mood capture
- Admin reporting
- 3+ years live
0+ yrs
Live and continuously supported
0
App store barriers to entry
0
Dashboards: owner & admin
0%
Paper-based science, digitised
Science that lived on paper, reborn as a digital diary
CorPerformance specialises in workplace performance - addressing mental health, mood and productivity together. They brought years of science-backed, paper-based methods and wanted them transformed into something people would actually use every day.
The concept was simple: a digital diary where users record their highs and lows, recognise patterns, and gauge their emotions against clear benchmarks - something many people struggle with when there's no visual aid.
Our partner Mohunky led the client relationship, and Ralph Media designed the experience. We built everything that makes it work.
Three teams, one app
-
M
Mohunky
Client liaison, project management and ongoing support.
-
R
Ralph Media
UX/UI design - turning clinical data into a friendly flow.
-
H
Hayman.dev
The build - PWA, dashboards, reporting and data.
An install-free app with a serious engine behind it
From the PWA in employees' pockets to the dashboards that make sense of reams of mood data - here's the build.
Install-free PWA
No app store, no download friction - employees capture moods straight from the browser, on any device.
Mood capture
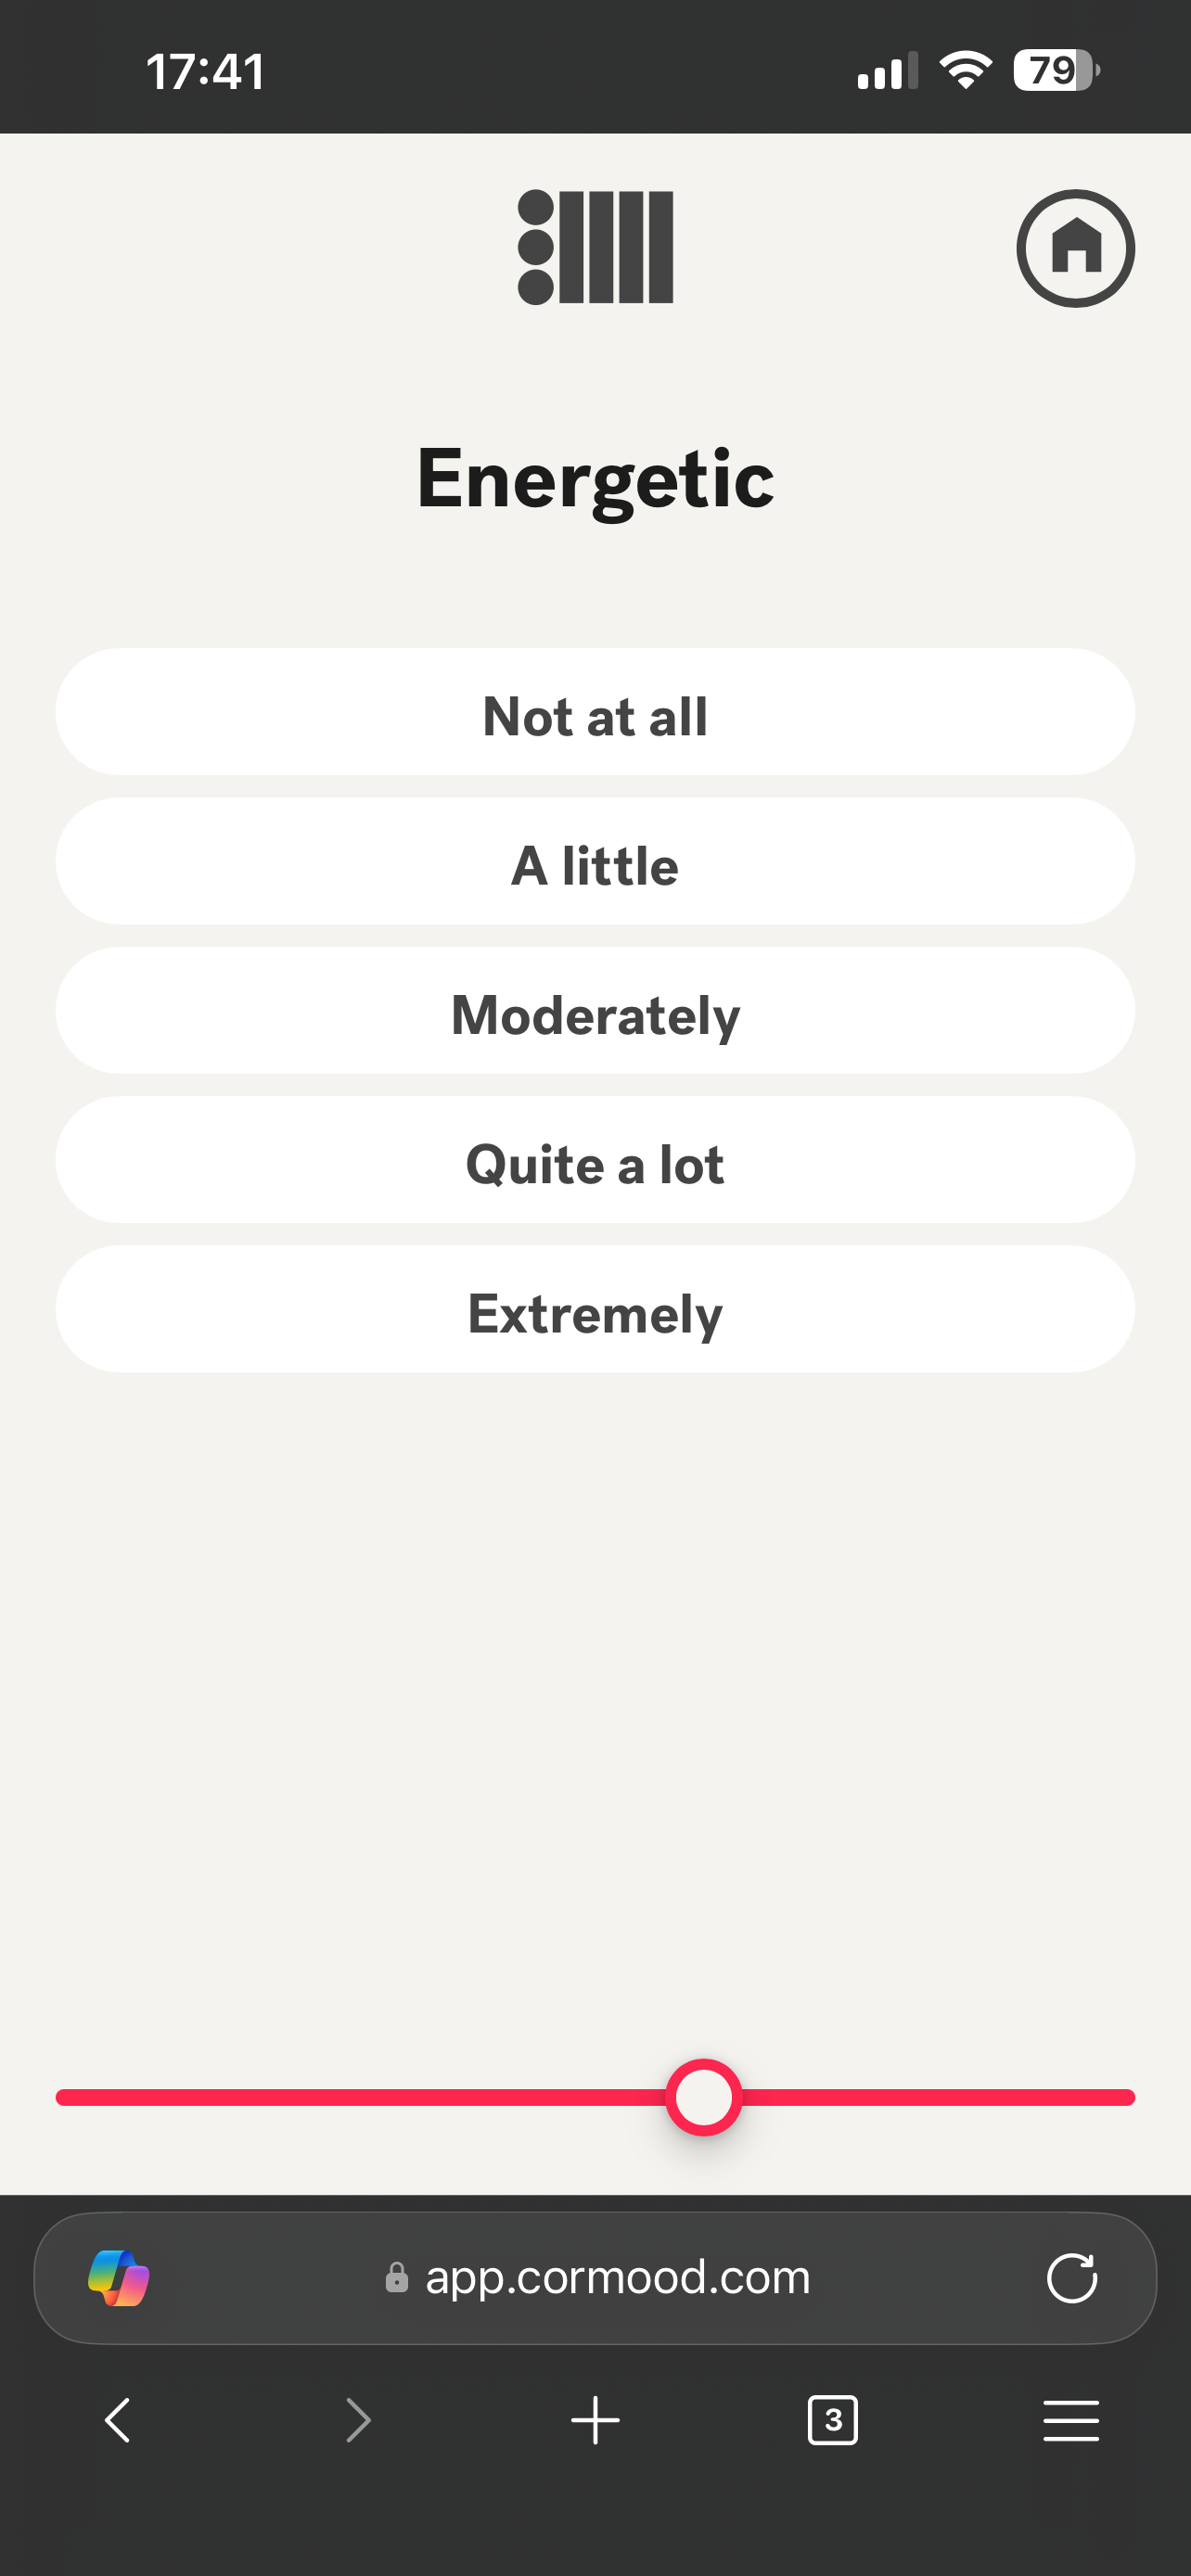
A choice of mood types and a quick check-in flow designed to take seconds - because a diary only works if it's easy.
Owner dashboard
A Product Owner dashboard manages clients and survey content - every deployment under control.
Admin reporting
Reams of data points turned into clear charts - usage, mean mood and trends at a glance.
Science-backed benchmarks
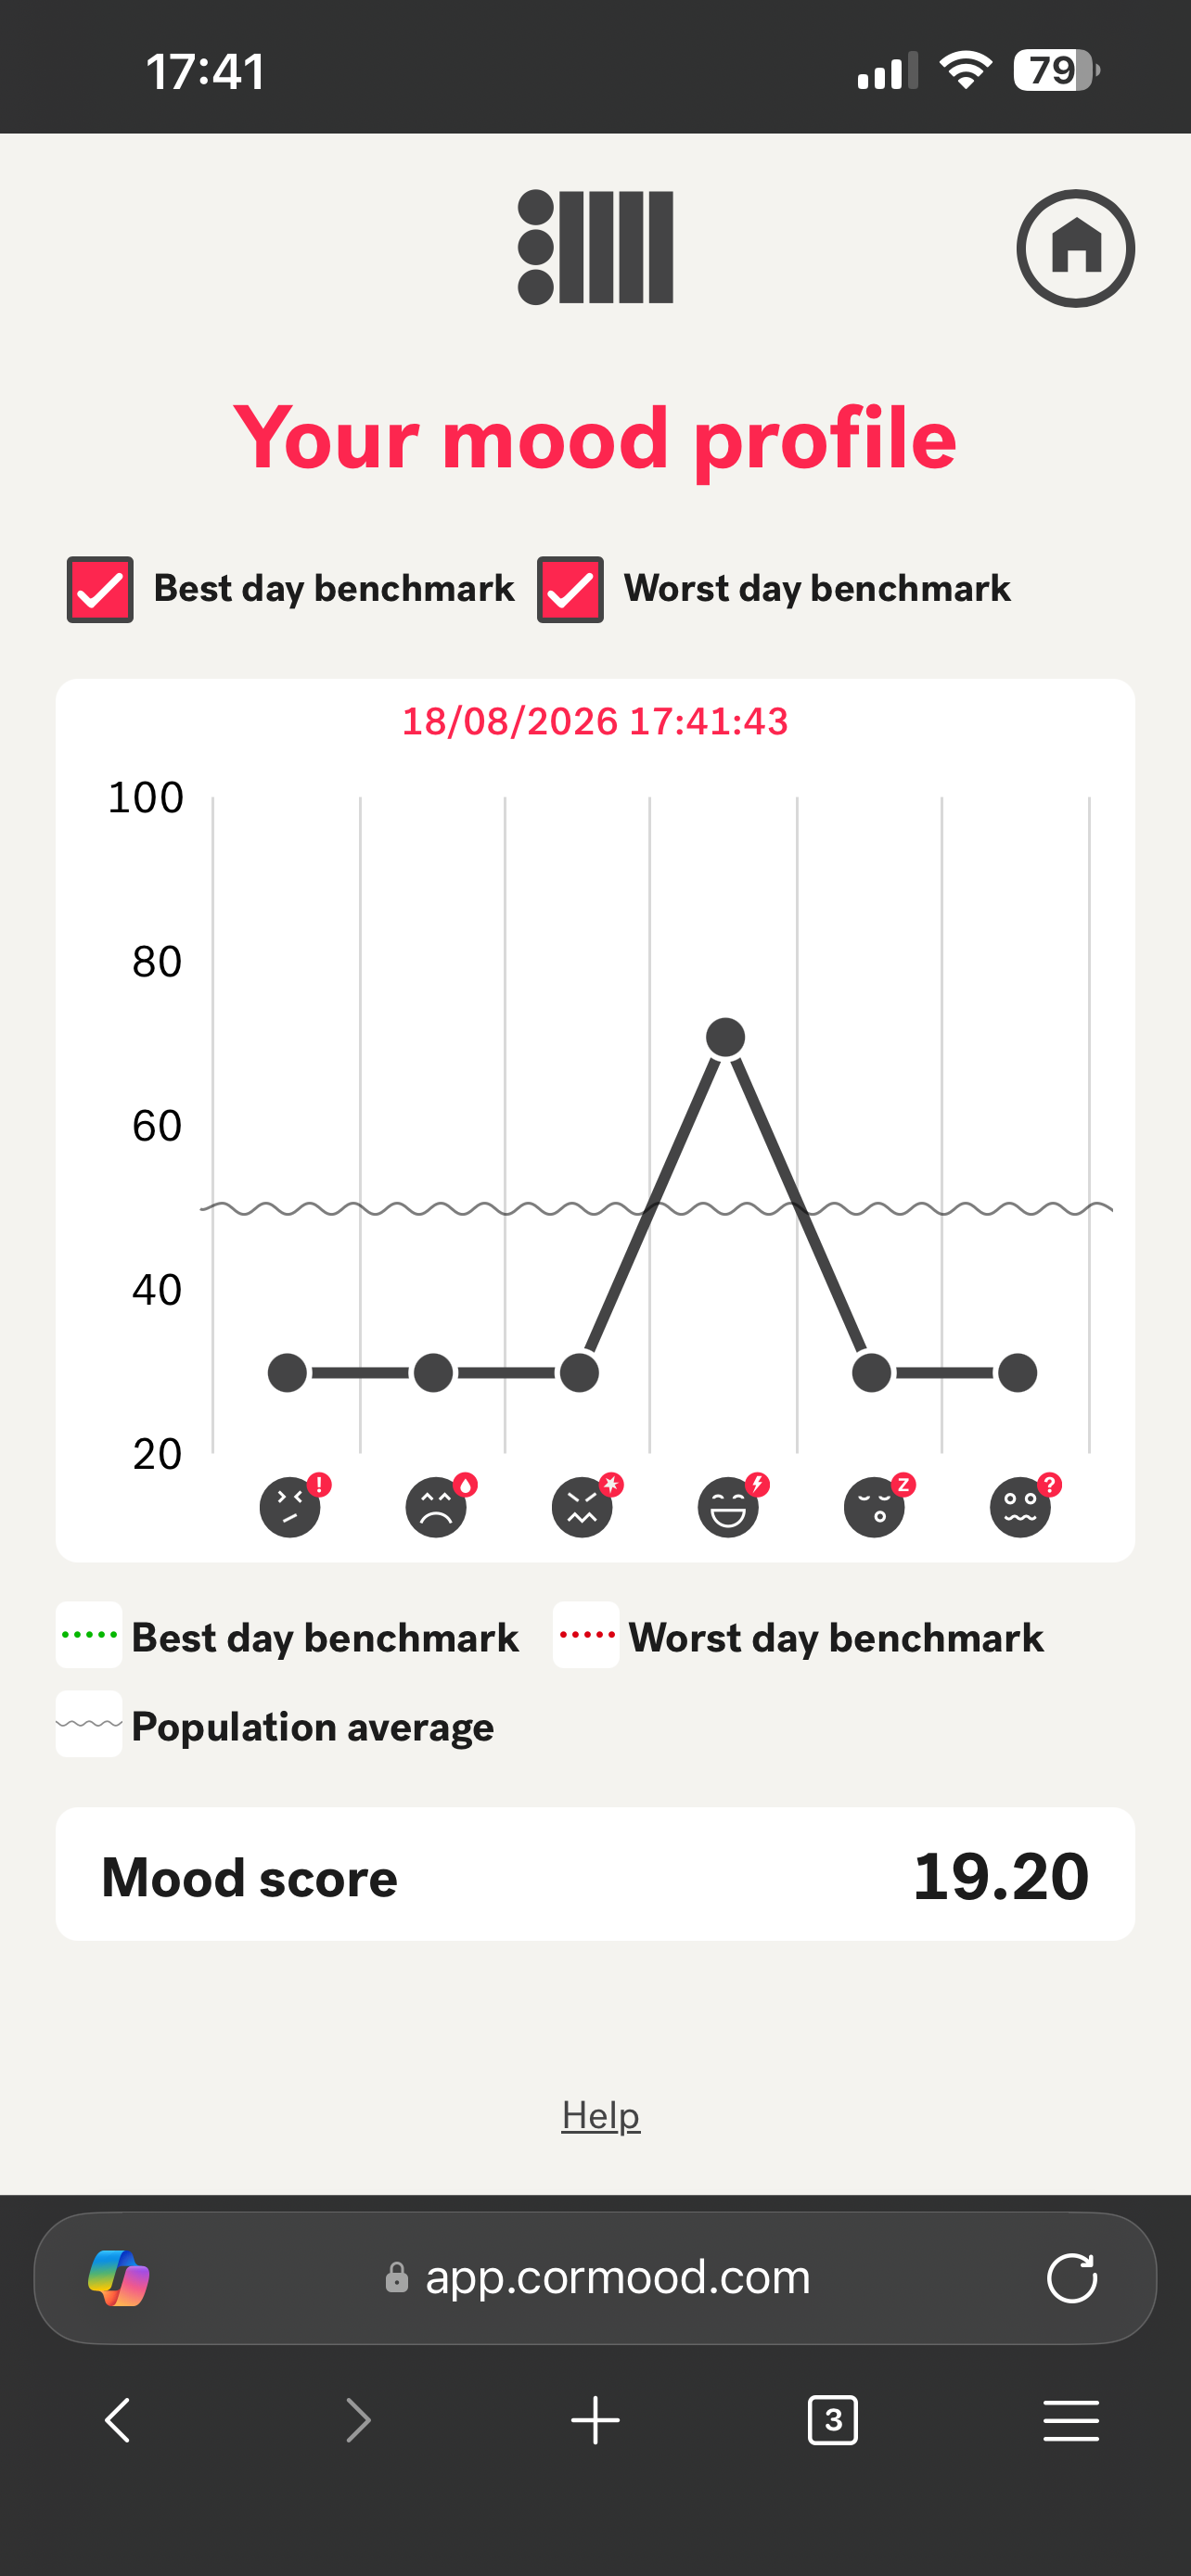
The paper-based methodology digitised faithfully - verified metrics that users can trust.
Built for Phase 2
The architecture is ready for what's next - enhanced visuals, mobile dashboards and advanced tracking.
Check in. See the pattern. Act on it.
The employee side is deliberately simple - a quick mood check-in, and a chart that turns emotions into something you can see changing over time.
Reams of data, distilled to what matters
On the admin side, CorPerformance reads the story of every deployment - usage, mean mood and team-level trends.
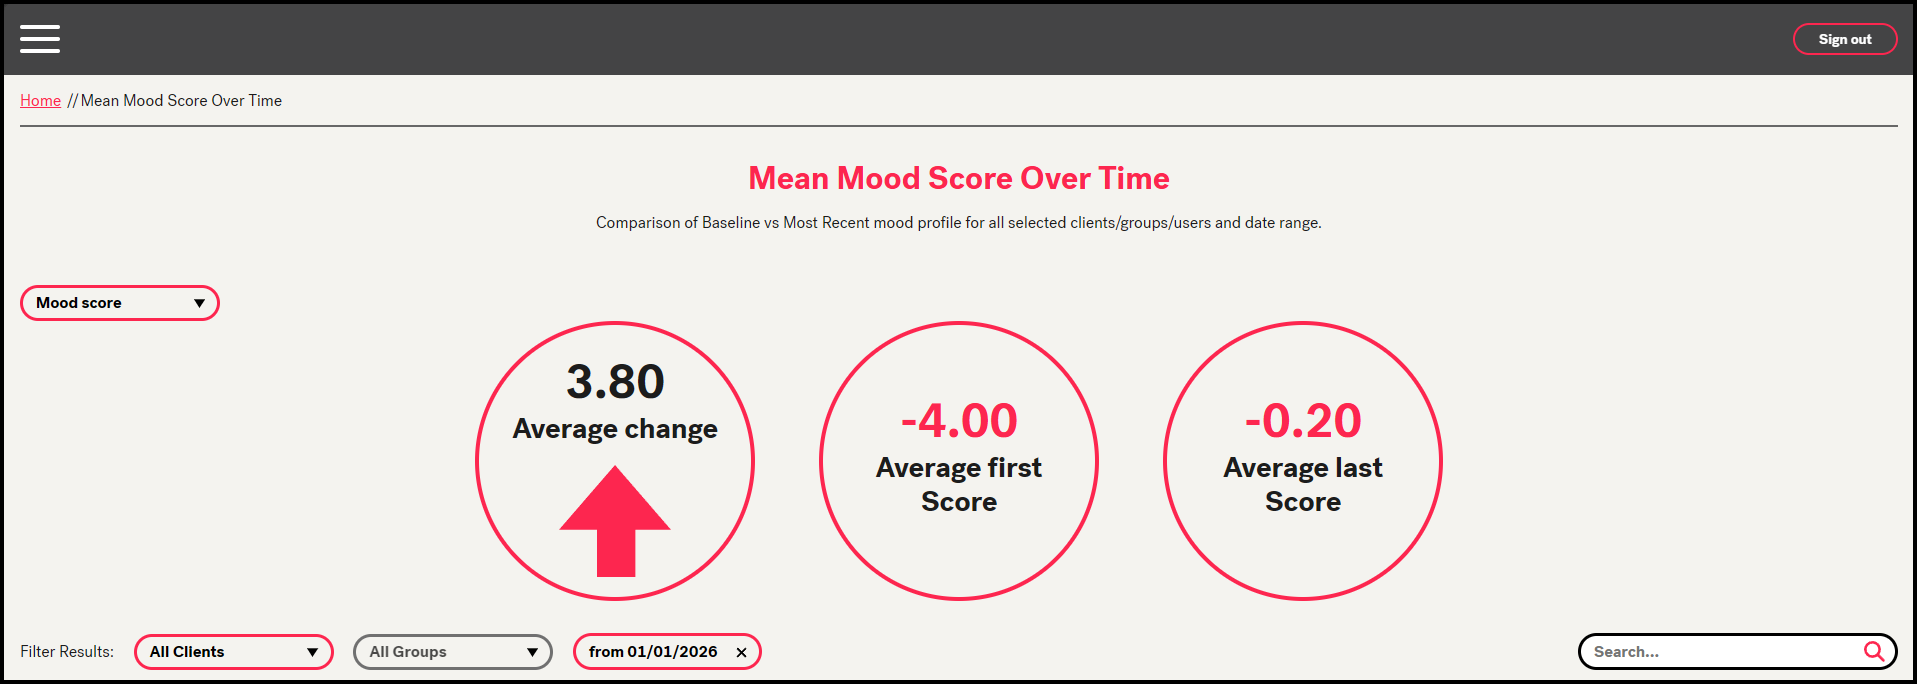
bolt Every check-in is scored, timestamped and aggregated live - trends surface as they happen, not at month-end.
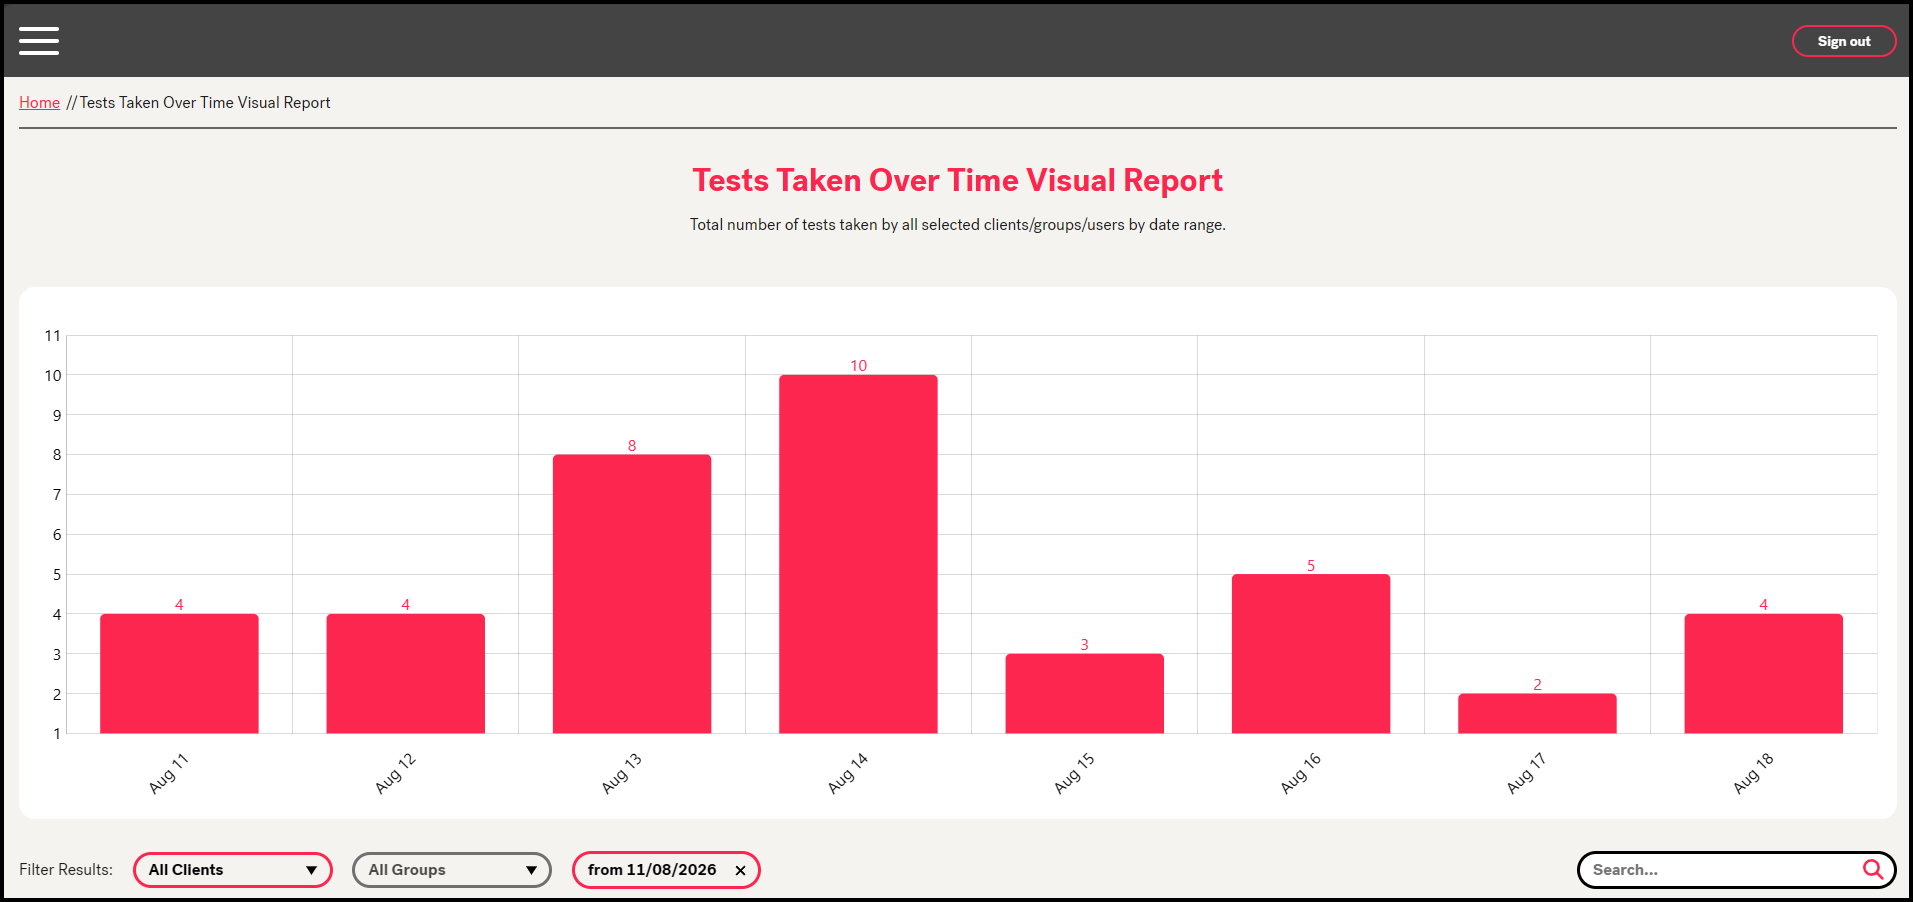
Check-in activity across every deployment
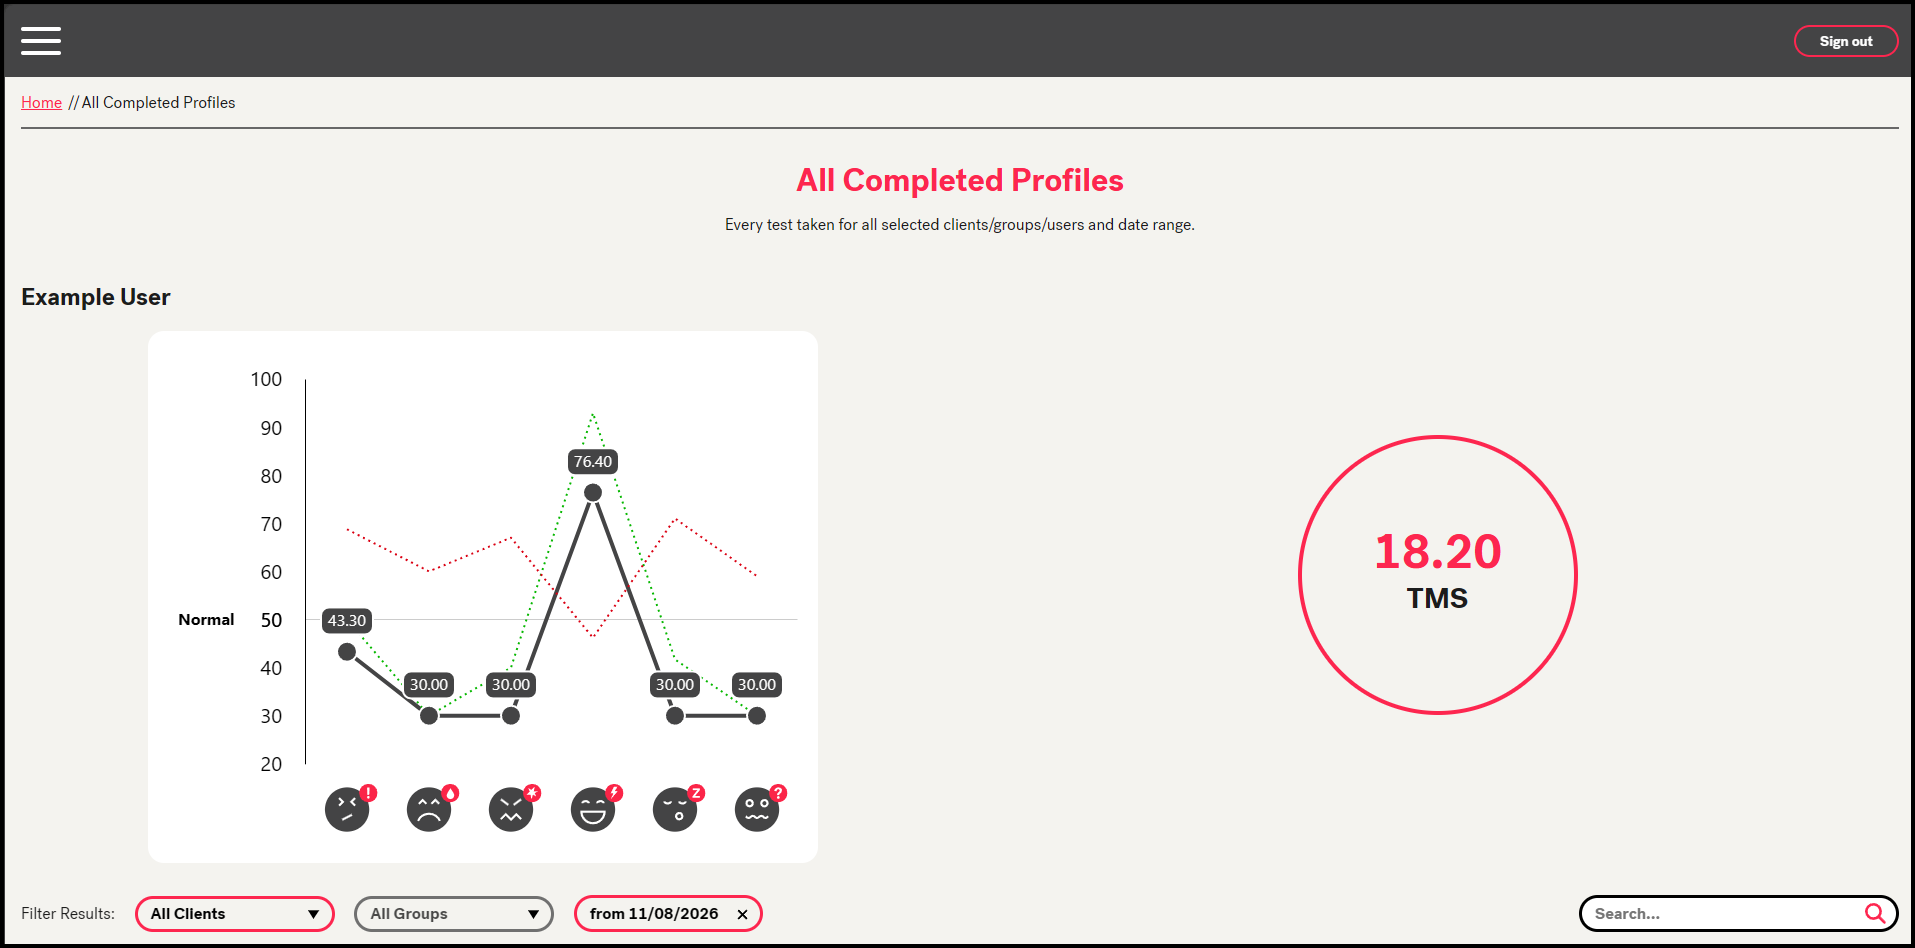
Benchmarked against validated science
What the numbers really tell you
Every chart on this page is generated live from real check-in data.
-
monitoring
Admin reporting aggregates reams of data points - every check-in lands in the charts as it happens.
-
dashboard
A Product Owner dashboard manages clients and survey content - every deployment under control.
-
install_mobile
The PWA captures moods from any device with zero install friction - so the data keeps coming.
More than an app - a wellness companion
The finished Mood Tool lets users monitor their mood over time, identify triggers for low periods, and develop a greater sense of emotional awareness. By making the intangible visible, it empowers people to take proactive steps with their mental health.
It's now being sold into multiple companies - a 3+ year partnership, with the platform continuously supported and extended.
We don't just maintain. We advance.
Phase 2 focuses on enhancing user visuals, improving mobile dashboards, and integrating advanced mood tracking - driven by real user feedback.
We anticipate trends so the app stays cutting edge - not just responsive to updates.
Let's digitise your methodology
A PWA, a dashboard, a reporting engine - whatever your process looks like, we'll engineer the platform that brings it to life.
No hard sell • A real engineer on the first call